Automated Analytics Dashboards

Why are Effective Dashboards Critical?

Ideally, dashboards make it easy for end-users to consume the data they have produced in their analytics implementation, and, in so doing, answer stakeholders’ initial business questions. In reality, though, creating effective dashboards means overcoming several obstacles.

Common Challenges

Delivering on initial promises takes a long time. Between the exciting stakeholder/analyst conversations about what revelatory data will be learned through an analytics implementation and the actual delivery of said data, lots of steps need to happen. Even if all of these steps are done correctly, it can take weeks or months for business stakeholders to get the data they need!

It’s difficult to know how to act on the data. When the data finally is available, business users don’t always know how to take advantage of it. This is especially true if you have a large implementation with many data points.

Sometimes the data delivered isn’t the data that was promised. Remember the kids’ game “telephone”? Sometimes a business question is passed to solution architects, then developers, then analysts, until the end result bears no resemblance to what was originally requested by the business.

Each unique business question must traverse ALL these obstacles. Since almost all digital analytics implementations are custom, the implementation of every business question is unique.

How Apollo Automates Analytics Dashboards

Apollo provides ways to bridge the gap between business user expectations and what analytics implementations deliver. Apollo starts with standard, best-practice business requirements (questions). This helps ensure that the analytics team and its business stakeholders are on the same page about what questions are meant to be answered. Since Apollo integrates all aspects of the implementation, these business questions have pre-built solution designs, data layer elements, tagging specifications, tag management configurations, analytics tool variable configurations, and eventually dashboards. This means that there is a direct line from business question to dashboard, which helps minimize the risk of failure and avoid the “telephone” scenario described earlier.

Apollo gets data into the hands of business users immediately. While it is great that tools like Apollo can help reduce the time it takes to get data, that still doesn’t help if there are no reports or dashboards ready for end-users when the implementation is completed. To remedy the latter, instead of forcing your team to manually create hundreds of analytics dashboards, Apollo automates the creation of analytics dashboards. This means that upon the completion of the implementation, you can create dashboards with the click of a button so that your users can instantaneously have access to the data they need. These dashboards are tied directly to the business questions they originally requested when the implementation began.

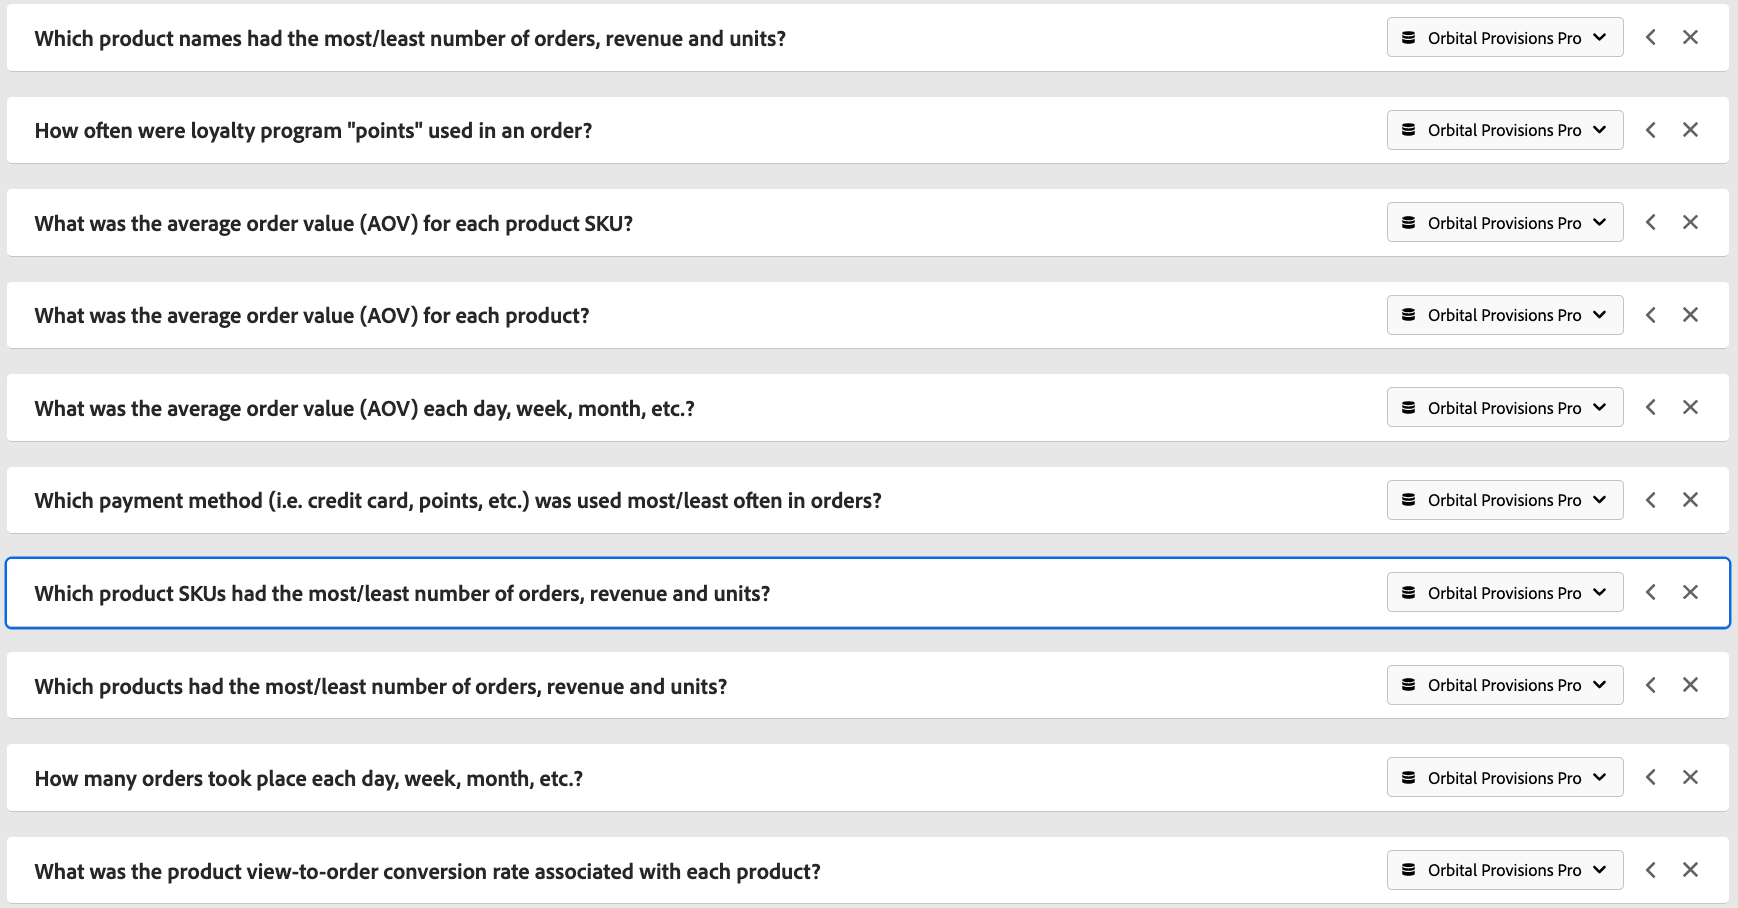
Automating the creation of dashboards is made possible through the interconnectedness of Apollo. Since Apollo knows which data elements are associated within each business requirement, these data elements can be used for both tagging and reporting. For example, if a business requirement like the one below utilizes product SKUs, orders, revenue, and units…

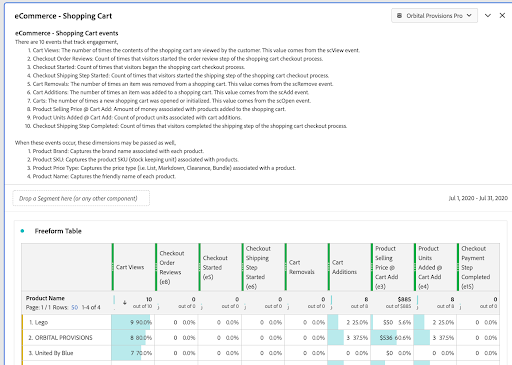
…Apollo can use this information to automatically create a dashboard report that combines these same elements.

This allows your business users to hit the ground running when the implementation is completed without taxing the analytics team to manually create hundreds of reports and dashboards.

What This Means for Your Business

Check

Expediency

Apollo applies intelligent automation to expedite the “time to data” for your organization. The automation of dashboards and reports helps your end-users get their hands on your data as soon as tagging is complete.
Check

Simplicity

Data validation rules can be set up once and then leveraged continuously to find and fix data quality issues as soon as possible. No more manual data quality checks or spot-checking data. You can know every time there is a data quality issue in real-time.
Check

Connectivity

The interconnected nature of Apollo enables this type of automation by leveraging automation where needed, but also by understanding how everything within the implementation relates to each other.
Check

Relevance

This means that your implementation and the associated reporting are always high-quality and up to date.

Ready to take a spin around Apollo?