
Implementation Visualization
Common Challenges
Conceptual Flatness. When it comes to implementing digital analytics, the traditional approach has been two-dimensional: You use a solution design document to list out the data points you want to track. But when you look at a solution design spreadsheet, it is virtually impossible to understand how all of the elements in your implementation feed and depend upon each other.
Fragmentation. All of the disparate documentation elements of the implementation are stored in separate files or systems, so it is difficult to see how requirements relate to solution designs, which relate to the data layer, and so on.
Introducing Apollo’s Visual SDR, a Revolutionary Concept!
Apollo is integrated and multi-dimensional. It relates all elements of the implementation to each other, so that a change made in one area updates all the other areas. By adding a visual element to this, Apollo can help show you the “forest for the trees.”
To understand the value of implementation visualization, let’s look at an example. Imagine that you have a simple eCommerce analytics implementation. In the implementation, you are tracking product views, orders, products, and SKUs. This can be modeled visually by Apollo like this.
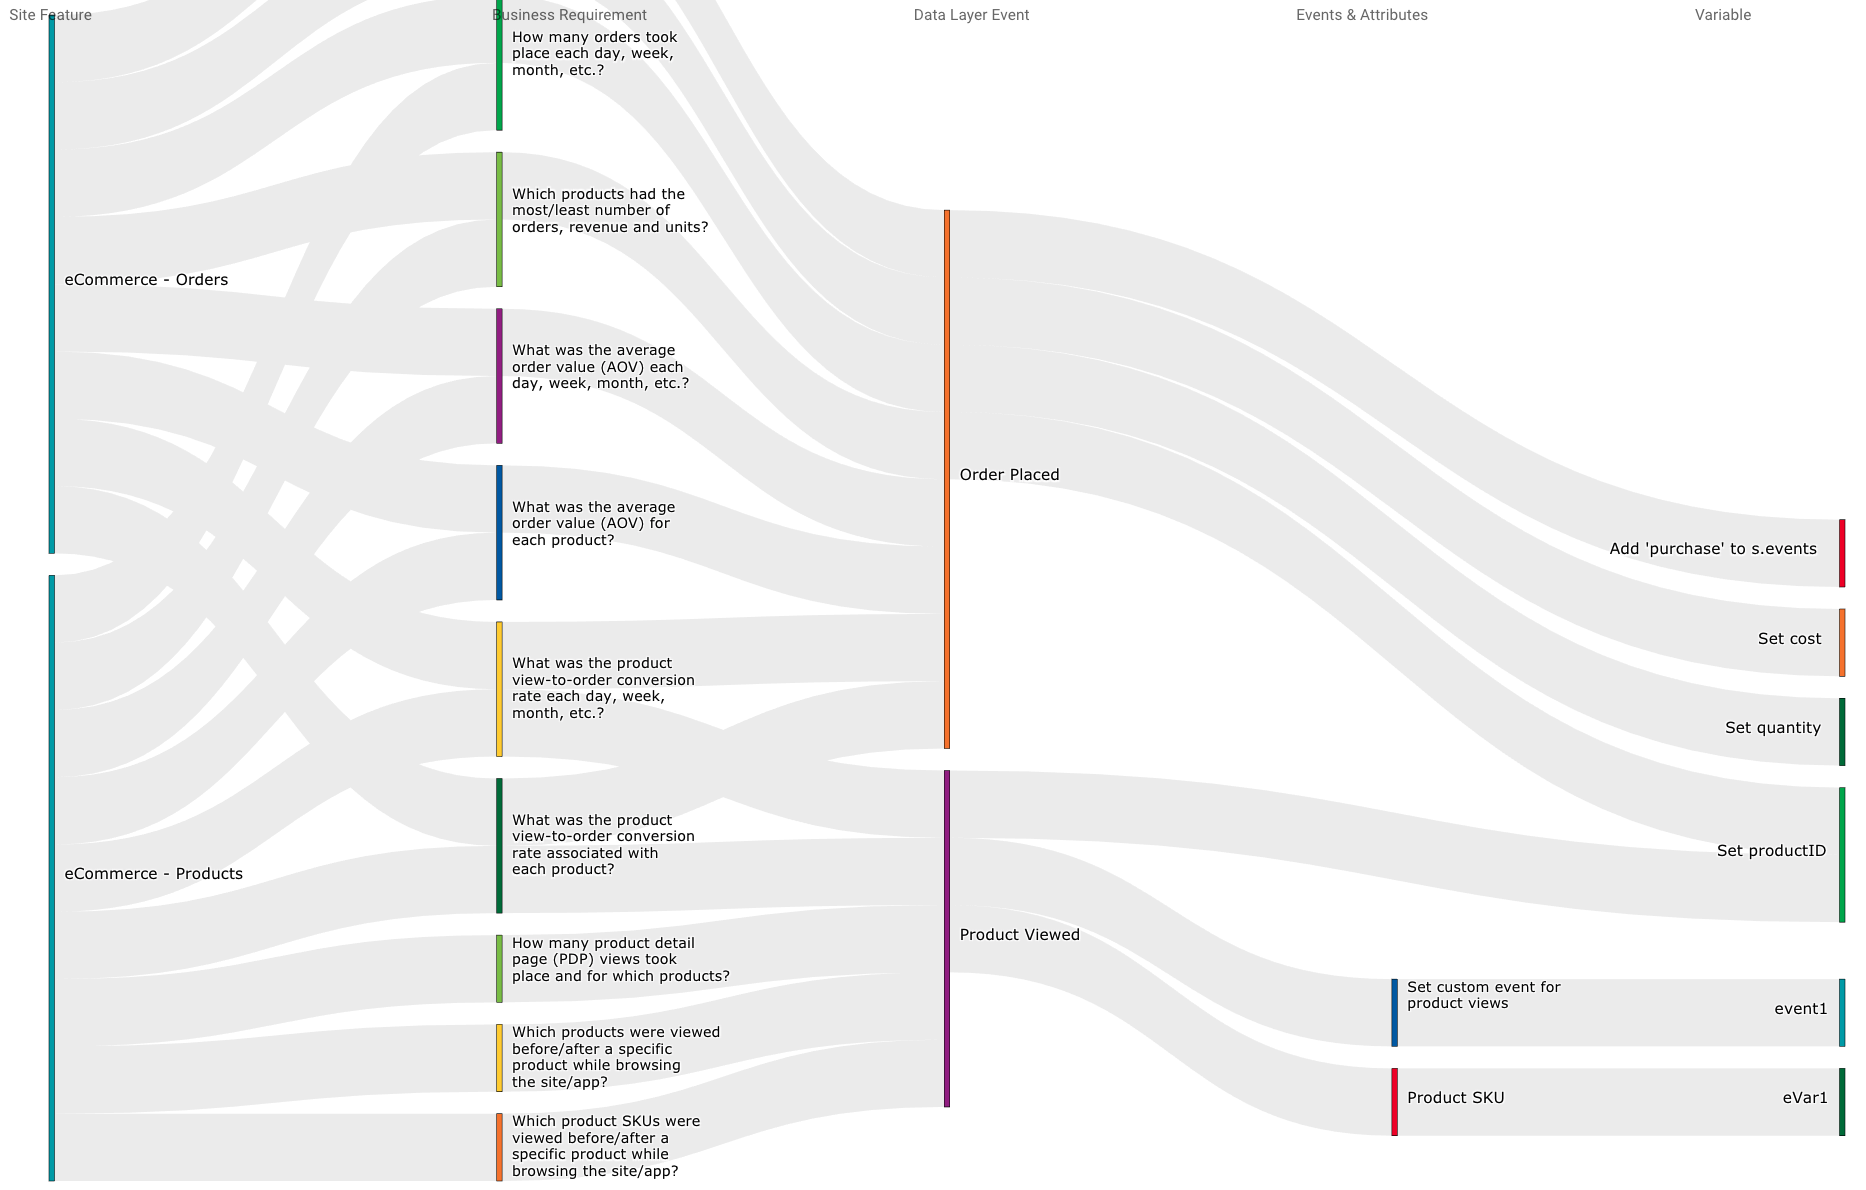
This view enables you to see the site features being used (eCommerce – Products & Orders), the business questions that can be answered, the data layer events that must be set, and the detailed data elements associated with each data layer event. You can see that the product ID data element is being used for both the Product Viewed and Order Placed events. But if you look closely, you may notice that something is not correct in our implementation. The Product SKU data element is being used for the Product Viewed event, but not the Order Placed event.
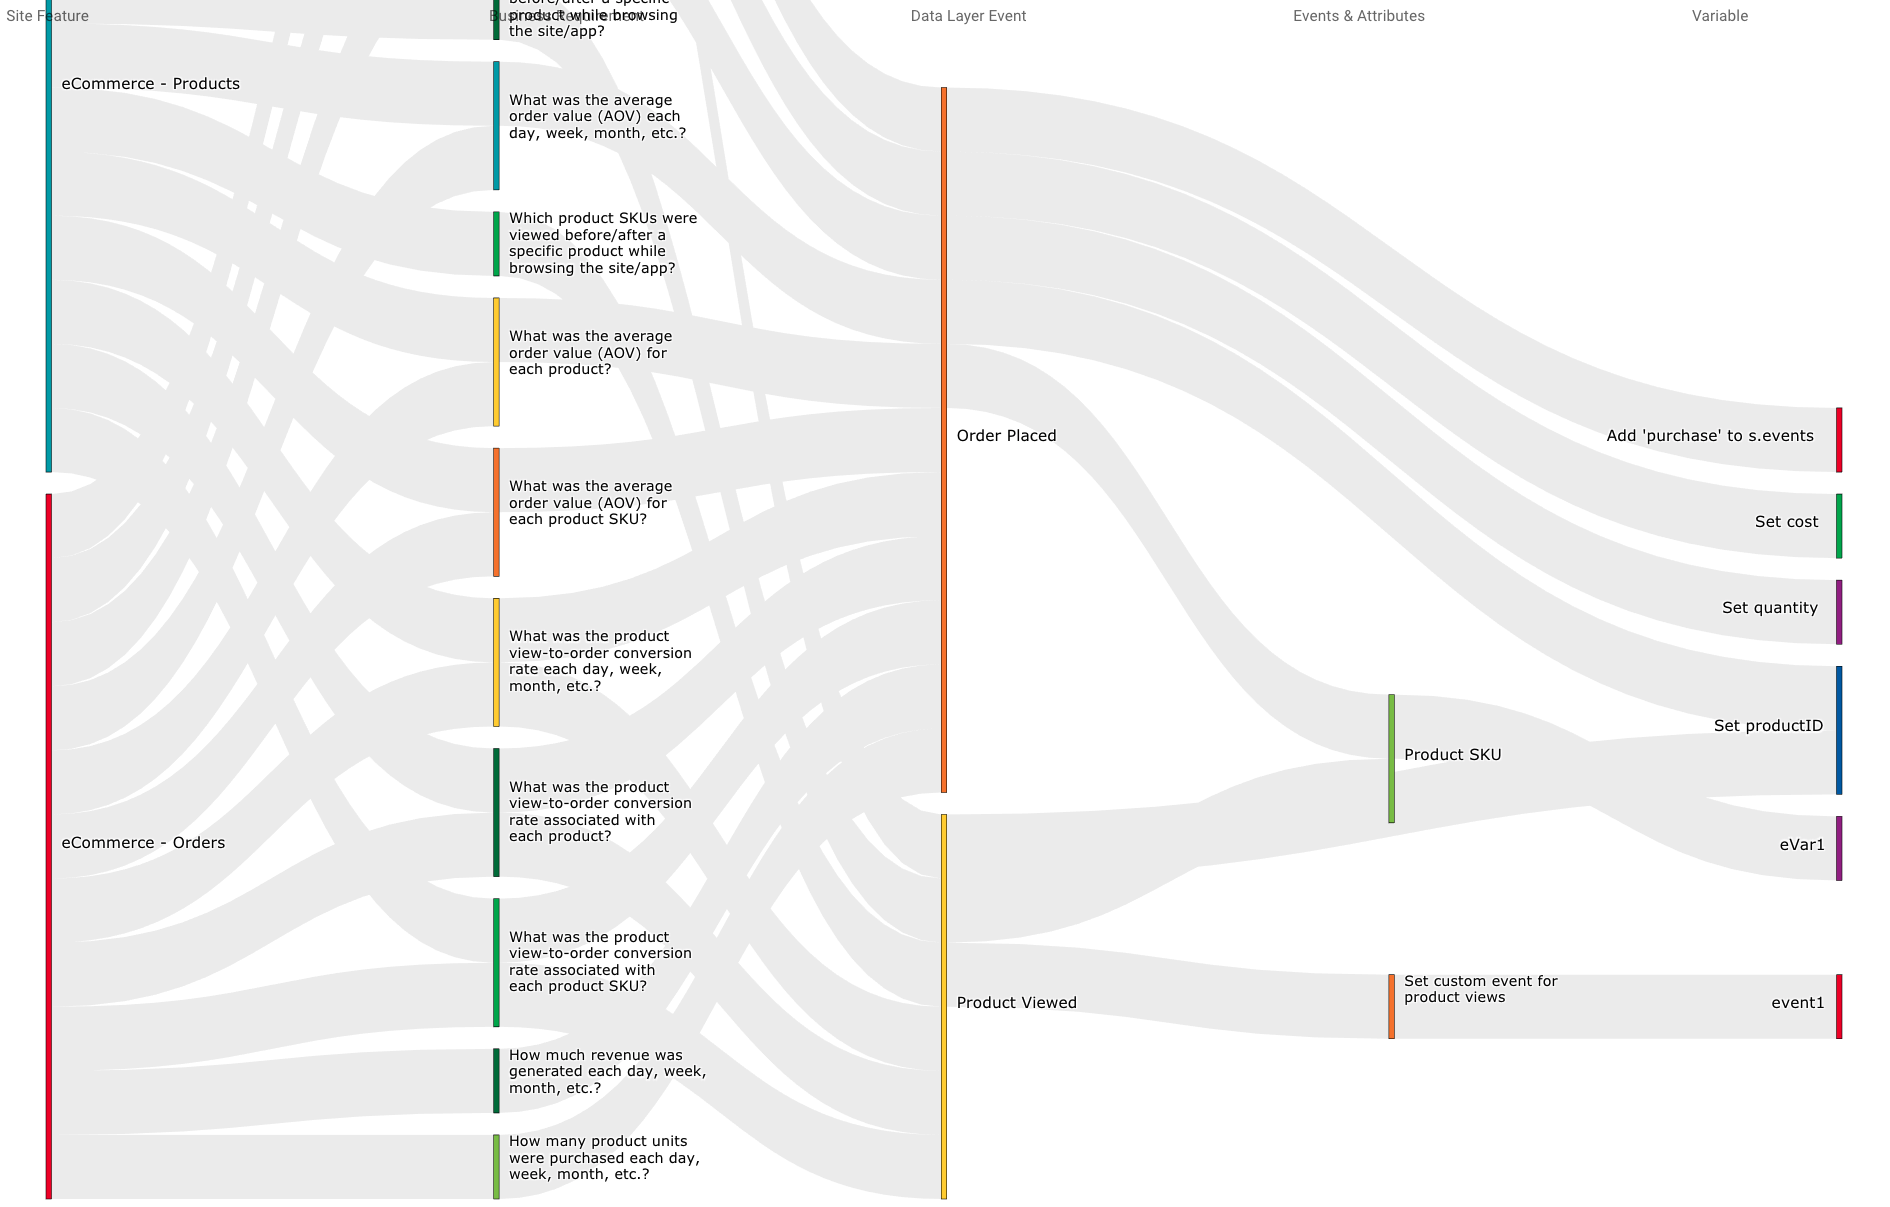
We likely want to set the Product SKU when Orders occur as well. Without this visual representation, we might have missed this and produced an incomplete analytics implementation. Having now seen this, with a few clicks in Apollo, the Product SKU data element can be added to the Order Placed event so that Product SKU is associated with both events as shown here.
As a side note, once we added Product SKU to the Order Placed event, you may have noticed that more business requirements were dynamically added to the implementation. This is due to the relational nature of Apollo, which programmatically recognizes when additional business questions can be answered as new items are added to the implementation.
When you really build out your implementation, things can obviously get a bit more complex! But there are many cases where being able to visualize what is going on in your implementation can be advantageous. Here is an example of a visualization of a large digital analytics implementation (which is so cool that it might justify buying a 100 inch TV!).
What This Means for Your Business

Efficiency
Since you’re able to visualize how your implementation is set up and graphically explore the implementation, you gain efficiencies when it comes to training or verifying that your implementation has been configured correctly.